Debunking the Climate Scam
Billions of Dollars -
Greedy Green Corporations -
No Warming For Two decades -
Bought and Paid For Organizations

http://www.drroyspencer.com/2009/05/global-
Global Warming Causing Carbon Dioxide Increases: A Simple Model
May 11th, 2009 by Roy W. Spencer, Ph. D.
Edited May 15, 2009 to correct percentage of anthropogenic contribution to model, and minor edits for clarity.
Global warming theory assumes that the increasing carbon dioxide concentration in the atmosphere comes entirely from anthropogenic sources, and it is that CO2 increase which is causing global warming.
But it is indisputable that the amount of extra CO2 showing up at the monitoring station at Mauna Loa, Hawaii each year (first graph below) is strongly affected by sea surface temperature (SST) variations (second graph below), which are in turn mostly a function of El Nino and La Nina conditions (third graph below):

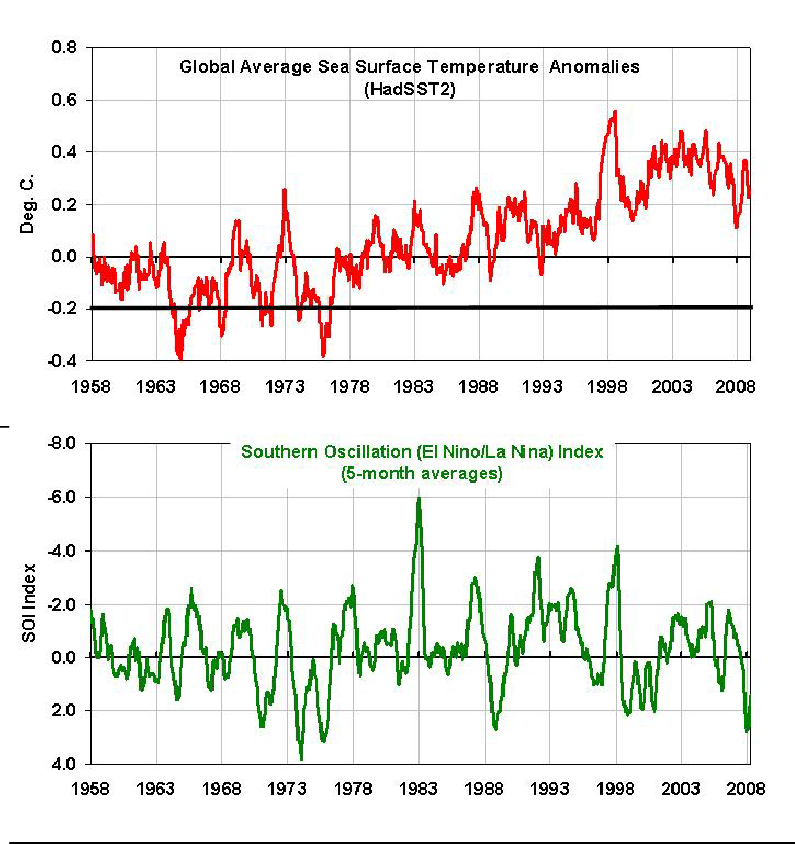
During a warm El Nino year, more CO2 is released by the ocean into the atmosphere
(and less is taken up by the ocean from the atmosphere), while during cool La Nina
years just the opposite happens. (A graph similar to the first graph also appeared
in the IPCC report, so this is not new). Just how much of the Mauna Loa Variations
in the first graph are due to the “Coke-
The direction of causation between carbon dioxide and SST is obvious since the CO2 variations lag the sea surface temperature variations by an average of six months, as shown in the following graph:

So, I keep coming back to the question: If warming of the oceans causes an increase
in atmospheric CO2 on a year-
I decided to run a simple model in which the change in atmospheric CO2 with time is a function of sea surface temperature anomaly. The model equation looks like this:
delta[CO2]/delta[t] = a*SST + b*Anthro
Which simply says that the change in atmospheric CO2 with time is proportional to some combination of the SST anomaly and the anthropogenic (manmade) CO2 source. I then ran the model in an Excel spreadsheet and adjusted an “a” and “b” coefficients until the model response looked like the observed record of yearly CO2 accumulation rate at Mauna Loa.
It didn’t take long to find a model that did a pretty good job (a = 4.6 ppm/yr per deg. C; b=0.1), as the following graph shows:

Since the long term rise in atmospheric CO2 has been averaging about 50% of human
emissions, the 0.1 value for “b” means that 20% of long-
The peak correlation between the modeled and observed CO2 fluctuation is now at zero month time lag, supporting the model’s realism. The model explained 50% of the variance of the Mauna Loa observations.
The best model fit assumes that the temperature anomaly at which the ocean switches
between a sink and a source of CO2 for the atmosphere is -
A graph of the resulting model versus observed CO2 concentration as a function of time is shown next:

If I increase the value of b from 0.1 to 0.2 (40% of the long term CO2 rise being
anthropogenic), the following graph shows a somewhat different model fit that works
better in the middle of the 50-

There will, of course, be vehement objections to this admittedly simple model. One will be that “we know the atmospheric CO2 increase is manmade because the C13 carbon isotope concentration in the atmosphere is decreasing, which is consistent with a fossil fuel source.” But has been discussed elsewhere, a change in ocean biological activity (or vegetation on land) has a similar signature…so the C13 change is not a unique signature of fossil fuel source.
My primary purpose in presenting all of this is simply to stimulate debate. Are we
really sure that ALL of the atmospheric increase in CO2 is from humanity’s emissions?
After all, the natural sources and sinks of CO2 are about 20 times the anthropogenic
source, so all it would take is a small imbalance in the natural flows to rival the
anthropogenic source. And it is clear that there are natural imbalances of that magnitude
on a year-
What could be causing long-
And just how strenuous and vehement the resulting objections are to what I have presented above will be a good indication of how politicized the science of global warming has become.
REFERENCES
Michael J. Behrenfeld et al., “Climate-
« Why America Does Not Care About Global Warming The MIT Global Warming Gamble »