Home Climate Facts Climate Briefs Alarmist Rebuttals Failed Predictions Historic News Clipings News Reports Russian Money How They Lie to YOU Its OK to Lie! CO2 Facts Warm Periods Lack Of Data Electricity Cost Climate Is Normal Heat/Cold Deaths Wild Fires Green New Deal No Rapid Waring Sun - Real Cause of Climate Alarmist errors C13/C12 Isotope Ratio oregon_climate_plan Tipping Points Climate Predictions IPCC Says Our Best Data 22 Inconvenient Truths Medieval Warm Period Extinctions Propaganda Fossil Fuel subsidies Who's Lying? What is Real Science Peer Review Adjustment Example proxies Climate Papers Debunking Claims NASA Debunk Antarctic Loss Renewables Corals Trillion Dollar Industry Big Money Scaring green money Paid by fossil fuel Warming Stopped Media Lies People are Dying History (politics) Extreme Weather? Its Warming,But Acidification IPCC_Flawed IPCC Prediction Fail IPCC_Disproved IPCC_PeerReview IPCC Scientists IPCC&CLouds WWF Infiltrated the IPCC Harming People misconduct Data Adjustments Major Data Tampering Cooling since 1945? Drought, hurricanes etc. Arctic History Selected Emails Selected Quotes Fraud Of Century? 97 percent of scientists 97% is meaningless 25% of AMS / 50% JonesInterview An OK Prediction Data Sources Record Temperature Energy Facts GridStorage CostlyEnergy Michael Mann Mann's Book Wegman on Mann paper styn_vs_mann Peer Review Error Statistical Errors The Sun Solar OceanHeat Ocean Heat Polar Bears OK AlGore's Errors Ask Questions Climate Models Record Highs Local Food Threats Why I'm a Skeptic GreenhouseMoon Alternative Energy 1350+ realist papers Conflict of Interest? Muzzeled Scientists How To Argue Common Ground Hurricane


Debunking the Climate Scam

Billions of Dollars -  Fudged Data  -  Corrupt Scientists

Greedy Green Corporations - Trillion Dollar Prize

No Warming For Two decades - Illiterate Media

Bought and Paid For Organizations


5000 Years Of Climate Change From Greenland Ice Cores

From:  http://notrickszone.com/2016/08/04/non-existent-relationship-co2-temperature-correlation-only-15-of-last-165-years/


85% of Time CO2 does not Correlate with Temperature!


The HadCRUT global temperature dataset that the IPCC references contains instrumental records that date back to the year 1850. Precise CO2 data (measured in tenths of parts per million)  from thousands of years ago can be found in Antarctic ice cores, with direct measurements (Mauna Loa) available since the 1950s.   In comparing the two records, it can be concluded that during the last 165 years, rapidly increasing CO2 concentrations only correlate with rapidly increasing global temperatures for one 25-year period (1977-2001).   Put another way, for 85% of the last 165 years there has been little to no correlation between CO2 concentration changes and temperature changes. - See more at: http://notrickszone.com/2016/08/04/non-existent-relationship-co2-temperature-correlation-only-15-of-last-165-years/

From:  http://theendofthemystery.blogspot.in/2016/03/the-bottom-line-about-climate-science.html


The Bottom Line About "Climate Science" and "Global Warming"


The following image is my version of one presented to the public, on USAToday, in October 2010). It embodies, for me, the central truth about "global warming" and the "climate science" behind it, that everyone (particularly any "expert" who defends it, and any politician--like President Obama or his Attorney General--or dogmatic ideologue who demands obedience to it) needs o know and accept:

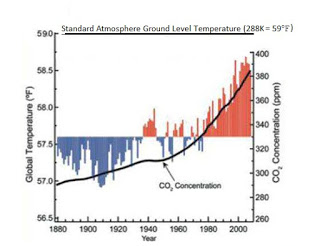
The original image purported to show that the "global temperature" (more correctly, the global mean surface temperature, or GMST) has increased with the increase in atmospheric CO2 concentration, since 1880.


Note, in the graph, that the temperature is shown as apparently closely tracking (to the eyes of the unwary, non-scientific layperson) the rise in CO2, from about 1975 on (to the end of the graph, about 2008). I say the temperature "apparently" tracks the CO2, because the scales of the two superimposed graphs have been selected to show just that (again, to "make it clear" to the non-scientist reader). The trouble is that the temperature data is very noisy, making that "jittery" appearance in the temperature graph, and it doesn't really follow the smooth CO2 curve all that well, particularly from 2000 on.


Now, honest scientists can legitimately argue over just how well or how bad the temperature tracks the CO2 from 1975 on, based solely upon this illustration as presented to the public by leading climate scientists. What cannot be honestly argued about, however, is that the temperatures BEFORE 1975 do NOT track the rising CO2; they vary, both positively and negatively, independently of the ever-rising CO2. That is the first simple, and devastating, point to be remembered by everyone, even those who are uninterested, or uneducated, in the debate.


This was so apparent to me, when I first came upon this image, that I posted the following comment:


"The graph shown here arbitrarily puts the CO2 curve on top of the temperature record so that the two curves rise together after 1979--but only after 1979, note. As an independent scientist, I do not hesitate to call this what it is: fraudulent science. This is very ugly, raw political propaganda in the name of science. All scientists should be repulsed, and ashamed, by the breadth and depth of the incompetence in their midst, and the foisting of that incompetence upon the public."


Since the public debate was not about the science, but was and is in fact a political war, my small voice for real science was ignored, as it has been by most ever since.


Read the rest at:  http://theendofthemystery.blogspot.in/2016/03/the-bottom-line-about-climate-science.html