Debunking the Climate Scam
Billions of Dollars -
Greedy Green Corporations -
No Warming For Two decades -
Bought and Paid For Organizations

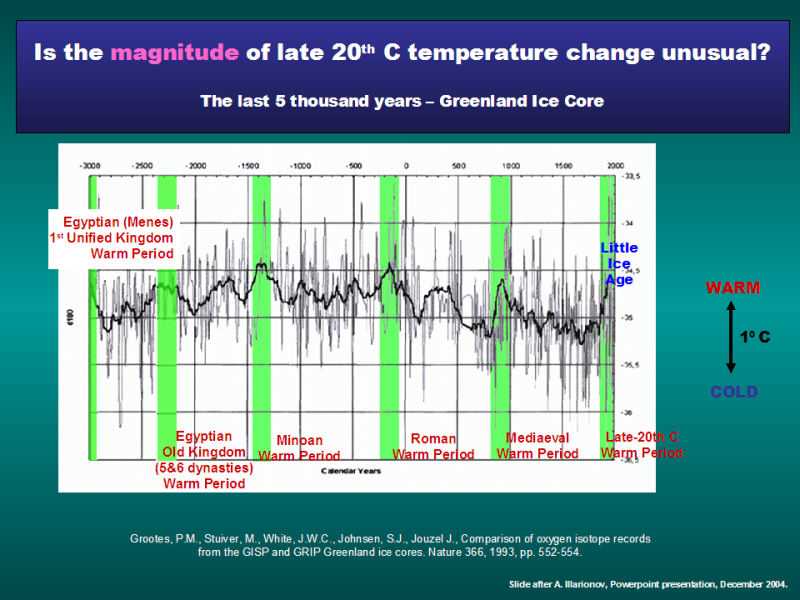
5000 Years Of Climate Change From Greenland Ice Cores

Examples of NASA Climate Alarm
A Debunking of “Climate change: How do we know?” at https://climate.nasa.gov/evidence/ (local copy)
Webmaster Note:
We believe that several NASA statements on their page below are presented in a manner intended to generate alarm by the way they state facts or by leaving out crucial information.
* For example, they say that Greenland and the Antarctic have lost several cubic miles of ice but fail to mention that it is a tiny amount, compared to the total amount of ice – it will take 45,000 and 500,000 years (a length of time equal to the last 4 ice ages) to completely melt. The next ice age will certainly come much sooner.
* They also mention ocean warming, but do it in degrees Farenheit, instead of the usual degrees Centagrade. This makes the warming seem bigger. The actual warming they claim is ONE THIRD of a degree Centigrade per century, a trivial amount.
* In several cases, NASA fails to mention that climate is cyclical and we have no data over a complete cycle, making conclusions impossible.
* All data have errors. In the climate field they are generally considered to be 0.1 to 0.25 degree Centigrade.
* The Earth went through a “little ice age” from about 1300 to about 1850. (https://en.wikipedia.org/wiki/Little_Ice_Age) Many temperature records start shortly after that so warming is naturally expected.
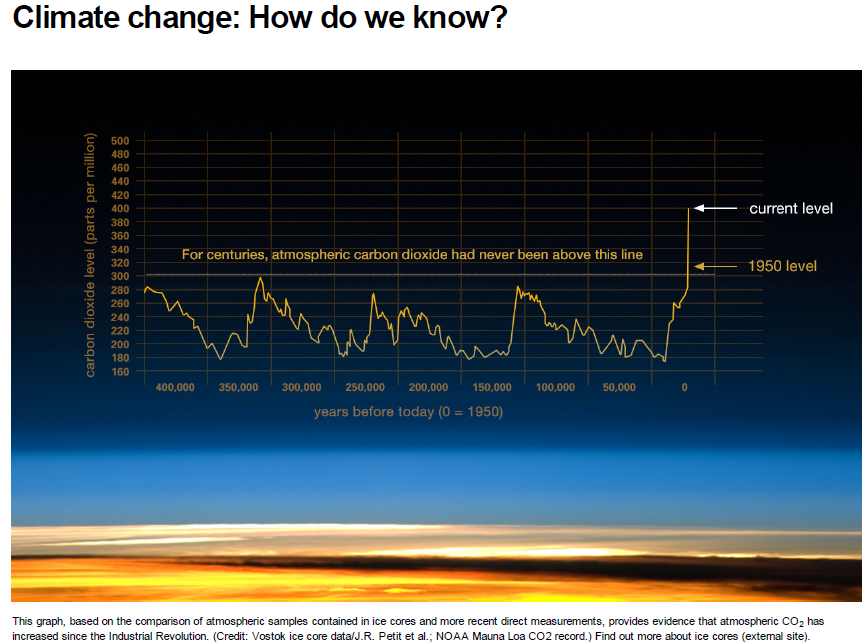
The NASA page, https://climate.nasa.gov/evidence/, starts with a picture showing current CO2 readings spliced to historical data. This is splicing of data is almost universally condemned as two datasets are usually not comparable. For instance, the current readings resolve daily CO2 levels ans show short peaks, while the ice core data cannot resolve anything less than several hundred years which hides any short term excursions such as today’s levels may be. Further there is controversy as to how accurate the CO2 level measurements are from ice cores.
.
|
NASA Claim |
|
THE FACTS |
|
The current warming trend is of particular significance because most of it is very
likely human- |
|
Statistically, the current temperature is within historical norms, leaving nothing to explain with human produced CO2: “...while some portion of the temperature change observed in the 20th century was
probably caused by greenhouse gases, there is a strong likelihood that the major
portion was due to natural variations.” From: An Estimate of The Centennial Variability
of Global Temperatures, Philip J. Lloyd, DOI: 10.1260/0958- The fact is that the oldest thermometer record we have, Central England Temperature , shows warming was faster in the 1600s. According to top IPCC scientist Phil Jones, the current warming IS NO FASTER than
the warmings of 1860- |
|
Earth- |
|
They fail to mention that climate has cycles that are thousands of years long, so the 40 year satellite record is too short to be meaningful. |
|
The heat- |
|
1.They say “increased levels of greenhouse gases must cause earth to warm” but they make no logical connection between the lab experiments of the 1800s and the real atmosphere with its many interrelated complex process such as convection, conduction, evaporation, winds, circulation cells, thunderstorms, hurricanes. 2.NASA ignores the fact that as early as 1900 it was recognized, by Knut Ångström, that CO2’s effect was masked by water vapor which has already absorbed the IR in the same bands as CO2. 3. There is actually NO empirical evidence that CO2 is casing global warming. 4. CO2 levels were probably naturally higher in the last 1000 years https://wattsupwiththat.com/2010/12/26/co2- |
|
Ice cores drawn from Greenland, Antarctica, and tropical mountain glaciers show that
the Earth’s climate responds to changes in greenhouse gas levels. Ancient evidence
can also be found in tree rings, ocean sediments, coral reefs, and layers of sedimentary
rocks. This ancient, or paleoclimate, evidence reveals that current warming is occurring
roughly ten times faster than the average rate of ice- |
|
1. They ignore the fact that CO2 FOLLOWS, NOT LEADS temperature. (A cause cannot follow its effect.) 2. According to top IPCC scientist Phil Jones, the current warming IS NO FASTER than
the warmings of 1860- NOTE: The IPCC says that man had not emitted enough CO2 before about 1950 to affect climate, so those earlier warmings were natural. |
|
|
|
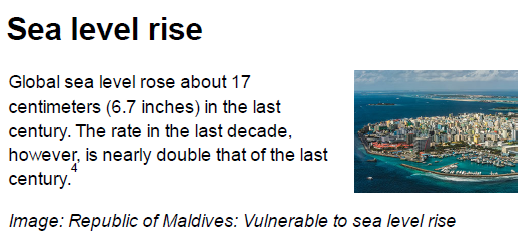
This graph from the USA government shows nothing unusual: How does sea level rise show that man is the cause? |
|
|
|
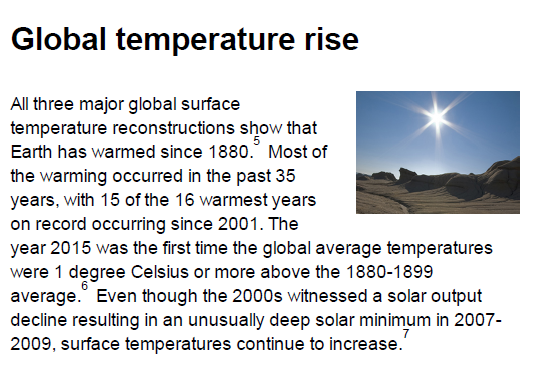
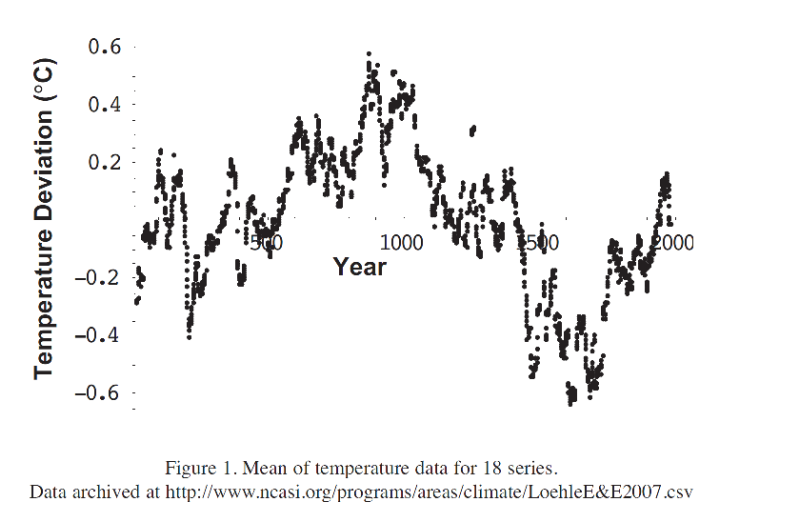
This ignores the fact that: 1. 1880 is the end of the “little ice age”, so warming since then is natural. 2. 1880 to present is just a tiny bit of climate history which goes back BILLIONS of years. 3. NASA fails to tell us that there were probably earlier, warmer, warm periods such as the Minoan, Roman, and Medieval times. This graph shows that Medieval times were warmer than now. It uses all peer- http://www.sustainableoregon.com/temphist.html
http://www.sustainableoregon.com/climatehistory.html How does global temperature rise show that man is the cause? |
|
|
|
Warming of 0.302 degree Fahrenheit since 1969 is 0.3 degree in 48 years, or about
0.6 degree per 100 years. Usually scientists describe climate in degrees Centagrade,
which would be ONE- How does warming oceans show that man is the cause? |
|
|
|
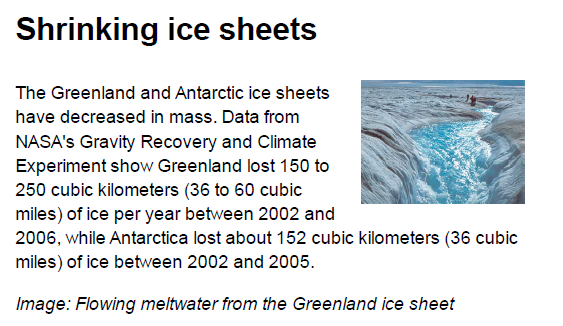
NASA says “Greenland lost 150 to 250 cubic kilometers (36 to 60 cubic miles) of ice per year” But they forgot to mention Greenland has 2,850,000 cubic kilometers of ice. That means that, at the stated rate, it will take 45,600 years (three times the length of time since the last ice age) to melt! https://en.wikipedia.org/wiki/Greenland_ice_sheet NASA says “Antarctica lost about 152 cubic kilometers” but neglects to say that the total ice mass is 26.5 million cubic kilometres, or about 523,026 years (a length of time equal to the last 4 ice ages!) at that rate. https://en.wikipedia.org/wiki/Antarctic_ice_sheet “ The Arctic ocean is warming up, icebergs are growing scarcer and in some places the seals are finding the water too hot, .... Exploration expeditions report that scarcely any ice has been met with as far north as 81 degrees 29 minutes. Soundings to a depth of 3,100 meters showed the gulf stream still very warm. Great masses of ice have been replaced by moraines of earth and stones, the report continued, while at many points well known glaciers have entirely disappeared.” Washington Post Nov. 2, 1922 This 95 year old report shows that Arctic ice has been low before. It is cyclical.
https://wattsupwiththat.com/2008/03/16/you- How does shrinking ice sheets show that man is the cause? |
|
|
|
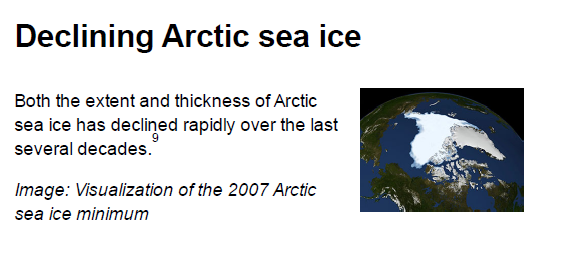
NASA says “Both the extent and thickness of Arctic sea ice has declined rapidly over the last several decades” but forgets to tell us: 1. It is mostly floating, so will have ZERO effect on seal level if it melts. 2. The ice loss is mostly because of changes in ocean circulation, not temperature. 3. It has happened before - Historic Variation in Arctic Ice Part2 https://wattsupwiththat.com/2009/04/26/ice- How does declining Arctic sea ice show that man is the cause? |
|
|
|
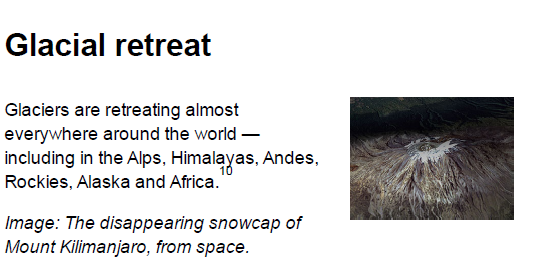
NASA says “Glaciers are retreating almost everywhere around the world — including in the Alps, Himalayas, Andes, Rockies, Alaska and Africa” but leaves out these facts: 1. Glaciers melted faster in the 1930s suggesting that the 1930s were warmer. http://www.debunkingclimate.com/glaciers.html 2. Glaciers have been melting since the end of the little ice age. 3. Glaciers grow and recede with the climate cycles. They respond to precipitation as well as temperature and can loose mass even when below freezing (sublimation.) 4. In 1904, Scientific American reported that alpine glaciers had receded considerably
for a long period of years, and that the Jakobshavn Glacier in Greenland had retreated
eight miles in 53 years – about two feet per day. https://realclimatescience.com/2016/08/scientific- How does glacial retreat show that man is the cause? |
|
|
|
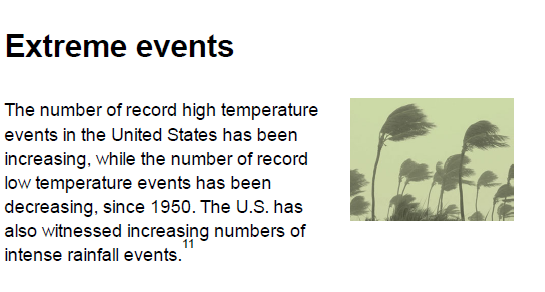
The claim of record breaking events is poorly supported. Intense rainfall has always happened, including in the recent past: https://wattsupwiththat.com/2017/02/17/californias- How do extreme events show that man is the cause? |
|
|
|
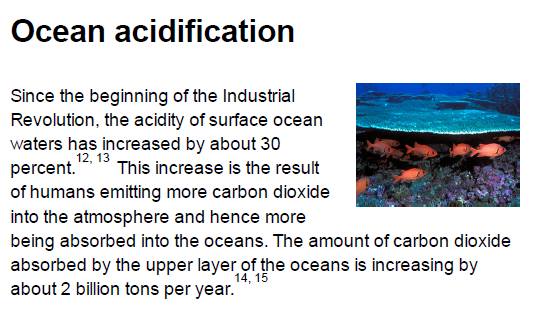
NASA says “Since the beginning of the Industrial Revolution, the acidity of surface ocean waters has increased by about 30 percent” 1. The oceans are NOT acid, they are firmly alkaline, so to say they are becoming more acid is merely an attempt to scare people. (A true statement would be that the oceans are getting less alkaline or moving towards neutral. But that is not scary enough for the climate scare industry.) 2. Acidity/alkalinity is measured on a log scale called Ph. On the Ph scale the oceans have allegedly decreased from 8.25 to 8.14 since 1751. This is very close to the limits of accurate measurement, so it may not be real. 3. Ocean Ph varies seasonally and by location by a larger amount than the alleged
change. https://wattsupwiththat.com/2015/01/02/a- 4. Contrary of alarmist claims, corals are not devastated by such changes. MORE: Analysis of Alarmism: Ocean Acidification AcidGate–- Review of the “Ocean Acidification” Hypothesis How does ocean acidification show that man is the cause? |
|
|
|
NASA claims “Satellite observations reveal that the amount of spring snow cover in the Northern Hemisphere has decreased over the past five decades and that the snow is melting earlier” but neglects to admit that we have virtually no data before satellites, so we really don’t know if this is unusual. We DO KNOW that Vikings farmed on Greenland and that some of those farms are still
under permafrost. https://wattsupwiththat.com/2009/10/26/on- How does that show that man is the cause? |


| Warming Stopped |
| NOAA Data |
| NorthWest |
| Oregon |
| Washington |
| Extreme Weather |
| Past Was Warmer |
| NASA: 30's Hotter |
| HistoryOFAlarmism |
| Central England |
| Temperature History |
| MultiProxy |
| treemometers |
| Northwest Passage |
| Acidification-Ball |
| Acidification-Fulks |
| Acidification-Idso |
| Selected Emails |
| CRU Emails - html formatted |
| CRU Emails Simple Format |
| CRU Emails UnFormatted |
| DCPS paper |
| CRU_Files_Notice |
| False Deadlines |
| Hockey Stick Links |