Debunking the Climate Scam
Billions of Dollars -
Greedy Green Corporations -
No Warming For Two decades -
Bought and Paid For Organizations

5000 Years Of Climate Change From Greenland Ice Cores

A careful study of climate history showed that there is a strong likelihood that the major portion of temperature change in the 20th century was due to natural variations.
Evidence: the Holocene records up to 8000 years before present, from several ice cores were examined.
. . . The average standard deviation of temperature was 0.98 ± 0.27 °C. This suggests that while some portion of the temperature change observed in the 20th century was probably caused by greenhouse gases, there is a strong likelihood that the major portion was due to natural variations.
From: An Estimate of The Centennial Variability of Global Temperatures, Philip J.
Lloyd, DOI: 10.1260/0958-
Global Temperature Record Can Be Explained By A Random Walk.
Random Walk analysis of NOAA global temperature anomaly data
Summary
The global temperature record doesn’t demonstrate an upward trend. It doesn’t demonstrate a lack of upward trend either. Temperature readings today are about 0.75°C higher than they were when measurement began in 1880, but you can’t always slap a trendline onto a graph and declare, “See? It’s rising!” Often what you think is a pattern is actually just Brownian motion. When the global temperature record is tested against a hypothesis of random drift, the data fails to rule out the hypothesis. This doesn’t mean that there isn’t an upward trend, but it does mean that the global temperature record can be explained by simply assuming a random walk. The standard graph of temperatures over time, despite showing higher averages in recent decades than in earlier ones, doesn’t constitute a “smoking gun” for global warming, neither natural nor anthropogenic; merely drawing a straight line from beginning to end and declaring it a trend is a grossly naive and unscientific oversimplification, and shouldn’t be used as an argument in serious discussions of environmental policy.
Read the whole analysis at: https://wattsupwiththat.com/2017/10/01/analysis-
There is Nothing unusual About Todays’ Climate
And That Is proof that Climate Change Is Not Man Caused
There is utterly NOTHING unusual about today's climate.
It has been warmer before
It has been cooler before
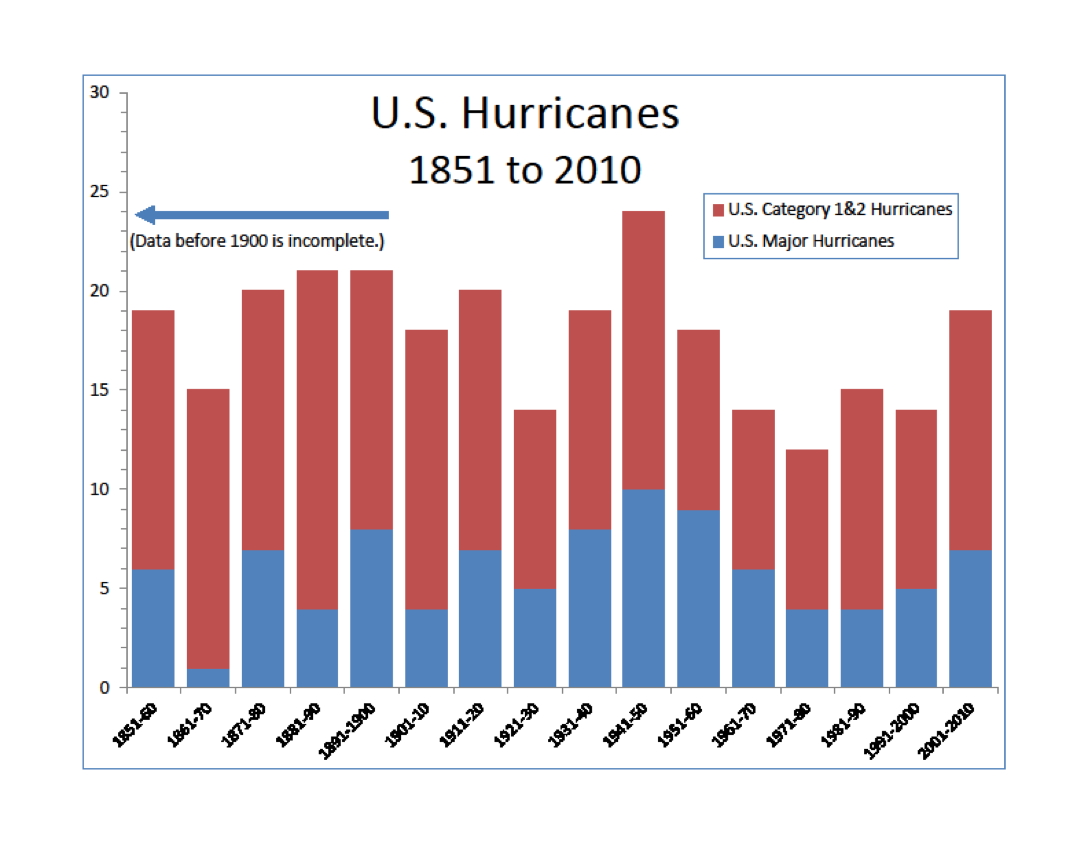
There were more storms previously
There were less storms previously
The rate of change of temperature has been faster in the past.
Same for droughts & floods
Same for all the other garbage the alarm industry claims.
Therefore there is noting to worry about & nothing to explain with CO2
Same for all the other lies the trillion dollar climate alarm industry spreads.
If that is not enough evidence then:
CO2 FOLLOWS TEMPERATURE and thus cannot be the cause of temperature changes.
You need more evidence:
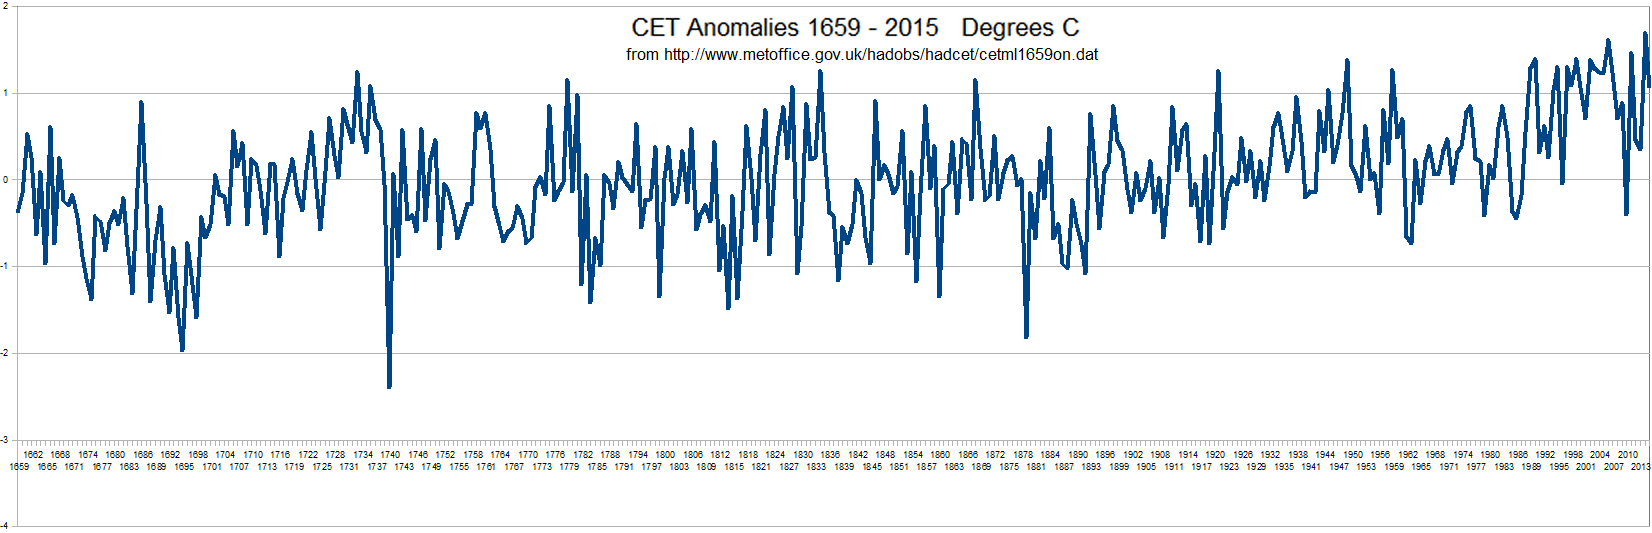
CO2 went up from 1949 to 1963 as temperature declined over 2 degrees. (CET data)
CO2 went up even more from 1990 to present as temperature was stable. (CET data)
Arctic warmed MORE in the early 1900s and faster than it did in the late 1990s which had much more CO2.
The evidence for the above:
Warmer than now: Minoan, Roman & Medieval warm periods
http://www.sustainableoregon.com/temphist.html
http://www.sustainableoregon.com/climatehistory.html
Cooler than now: little ice age
Faster rate of change than now:
1963 to 2014 warmed by 2.4 degrees, but 1879 to 1921 warmed faster at 3.07 degrees, 1784 to 1828 warmed faster at 2.47 degrees and 1692 to 1733 warmed by 1.66 degrees.
Overall, the highest temperature warmed by 0.45 degrees in 281 years and the lowest warmed by 0.78 degree in 271 years.
Again, there is NOTHING UNUSUAL about today’s warming. It is merely the continuation of a hundreds year warming after the little ice age. Here is the complete chart compiled by visually scanning the data:
1963 to 2014 warmed by 2.4 degrees, but 1879 to 1921 warmed MORE, by 3.07 degrees, 1784 to 1828 warmed MORE, by 2.47 degrees and 1692 to 1733 warmed by 1.66 degrees.
Overall, the highest temperature warmed by 0.45 degrees in 281 years
Again, there is NOTHING UNUSUAL about today’s warming. It is merely the continuation of a hundreds year warming after the little ice age.
years temperature change rate
1692-
1784-
1879-
1963-
Highs: 1733-
Lows: 1692-
Data is from Central England Temperature (CET) downloaded from the British Met Office: https://www.metoffice.gov.uk/hadobs/hadcet/cetml1659on.dat
Also see:
http://www.debunkingclimate.com/pictures/CET%20graph.png
http://www.metoffice.gov.uk/hadobs/hadcet/cetml1659on.dat
http://news.bbc.co.uk/go/pr/fr/-
Storms are normal:
http://www1.ncdc.noaa.gov/pub/data/cmb/images/tornado/clim/EF3-
Floods normal:
http://rogerpielkejr.blogspot.com/2011/04/decrease-
Droughts normal:
http://www.nature.com/nature/journal/v491/n7424/full/nature11575.html
https://wattsupwiththat.files.wordpress.com/2012/11/ccsp-
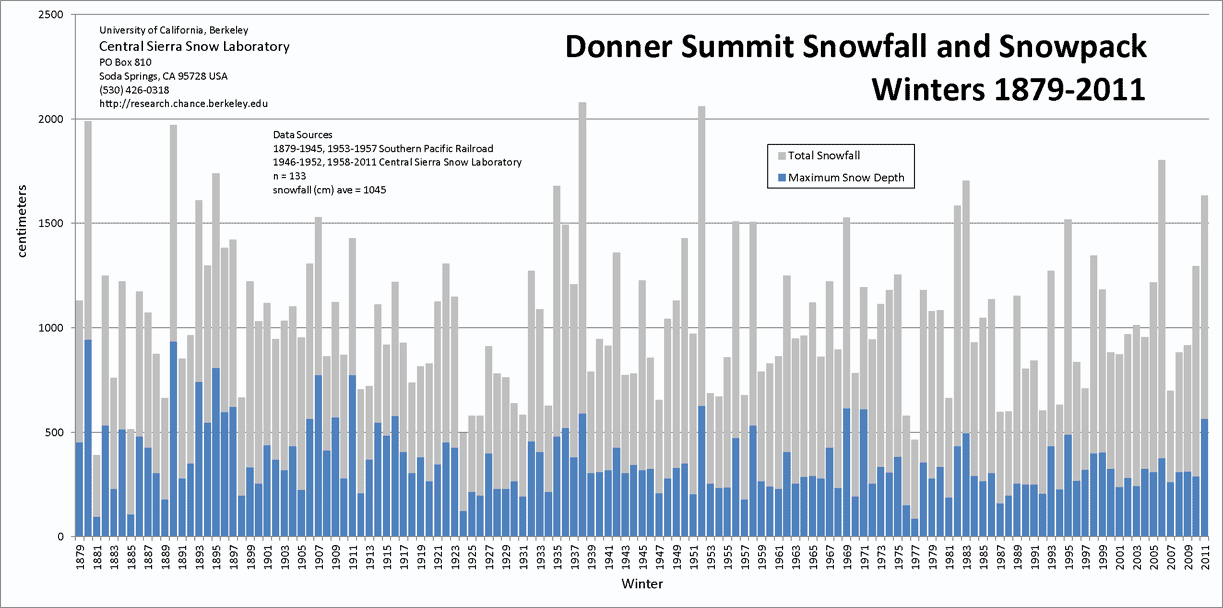
Snow normal:
http://climate.rutgers.edu/snowcover/images/nhland_season1.gif
http://www.thestormking.com/Weather/Sierra_Snowfall/a_2011-
Sea level normal:
http://www.jcronline.org/doi/abs/10.2112/JCOASTRES-
CO2 FOLLOWS temperature:
: http://www.debunkingclimate.com/co2_lags-
Version to post on web sites that block Links
For each link replace (.) With a single period since this site appears to block links.
Warmer than now: Minoan, Roman & Medieval warm periods
Cooler than now: little ice age
faster rate of change than now (per CET): 1740, 1878
Storms normal:
http://www1.ncdc.noaa(.)gov/pub/data/cmb/images/tornado/clim/EF3-
Floods normal:
http://rogerpielkejr.blogspot(.)com/2011/04/decrease-
Droughts normal:
http://www.nature(.)com/nature/journal/v491/n7424/full/nature11575.html
https://wattsupwiththat.files.wordpress(.)com/2012/11/ccsp-
Snow normal:
http://climate.rutgers(.)edu/snowcover/images/nhland_season1.gif
http://www.thestormking(.)com/Weather/Sierra_Snowfall/a_2011-
Sea level normal: http://www.jcronline(.)org/doi/abs/10.2112/JCOASTRES-
| Warming Stopped |
| NOAA Data |
| NorthWest |
| Oregon |
| Washington |
| Extreme Weather |
| Past Was Warmer |
| NASA: 30's Hotter |
| HistoryOFAlarmism |
| Central England |
| Temperature History |
| MultiProxy |
| treemometers |
| Northwest Passage |
| Acidification-Ball |
| Acidification-Fulks |
| Acidification-Idso |
| Selected Emails |
| CRU Emails - html formatted |
| CRU Emails Simple Format |
| CRU Emails UnFormatted |
| DCPS paper |
| CRU_Files_Notice |
| False Deadlines |
| Hockey Stick Links |