Debunking the Climate Scam
Billions of Dollars -
Greedy Green Corporations -
No Warming For Two decades -
Bought and Paid For Organizations

5000 Years Of Climate Change From Greenland Ice Cores

This page reformatted from: https://notalotofpeopleknowthat.wordpress.com/2014/12/05/educating-
Economic Costs
CLAIM
NOAA also keeps track of U.S. weather disasters that cost more than $1 billion, when
adjusted for inflation. Since 1992, there have been 136 such billion-
Worldwide, the 10-
FACT
Such figures are utterly meaningless, because they reflect changing economic and social conditions, rather climatic factors.
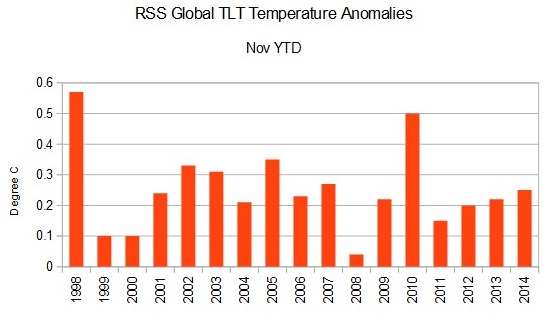
Temperature
CLAIM
It’s almost a sure thing that 2014 will go down as the hottest year in 135 years of record keeping
FACT
According to more accurate satellite measurements, this year is running as only the 7th warmest since 1998.
Oceans
CLAIM
The world’s oceans have risen by about 3 inches since 1992 and gotten a tad more acidic – by about half a percent – thanks to chemical reactions caused by the absorption of carbon dioxide, scientists at NOAA and the University of Colorado say.
FACT
Sea level has been rising steadily since the mid 19thC, with no evidence of long term acceleration.
In the last ten years, the rate of rise has decelerated by 44% to less than 7 inches per century.
Oceans have been becoming slightly less alkali, and not more acidic, assuming any changes have been measurable.
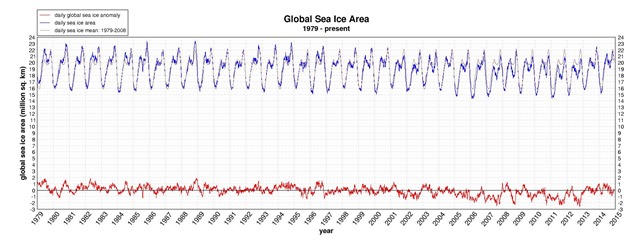
Sea Ice
CLAIM
Every year sea ice cover shrinks to a yearly minimum size in the Arctic in September
– a measurement that is considered a key climate change indicator. From 1983 to 1992,
the lowest it got on average was 2.62 million square miles. Now the 10-
FACT
In the last two years, Arctic sea ice extent in September has seen a strong recovery from the 2012 record low, and is close to 2005 levels.
Meanwhile, global sea ice area has been above average for most of this year.
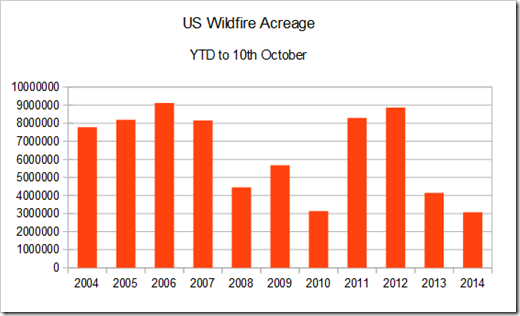
Wildfires
CLAIM
The effects of climate change can be seen in harsher fire seasons. Wildfires in the western United States burned an average of 2.7 million acres each year between 1983 and 1992; now that’s up to 7.3 million acres from 1994 to 2013, according to the National Interagency Fire Center.
FACT
Many forestry experts state that wildfire acreage is lower now than historically, and that fire suppression policies after 1950 have created the fuel for the bigger fires we have been seeing in the last decade or so.
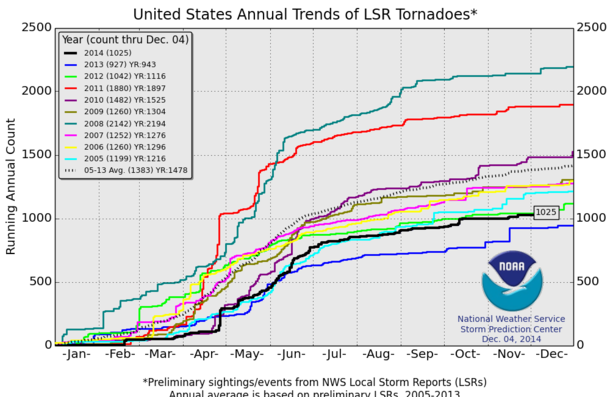

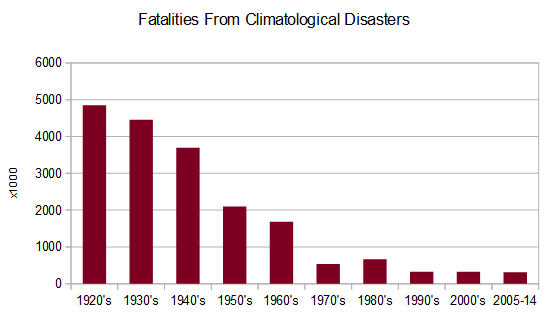
Wild Weather
CLAIM
Since 1992, there have been more than 6,600 major climate, weather and water disasters worldwide, causing more than $1.6 trillion in damage and killing more than 600,000 people, according to the Centre for Research on the Epidemiology of Disasters in Belgium, which tracks the world’s catastrophes.
FACT
As is often the case with these alarmist scares, the numbers they quote are given without any context.
According to the Centre for Research on the Epidemiology of Disasters (EMDAT), which he quotes, the death toll in the last two decades has been stable and running at a fraction of earlier decades.
According to the Centre, the death toll in 2013 was well below average at 21122, and this year so far is running at just 1594.
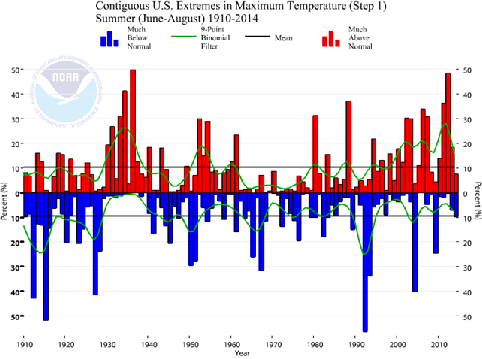
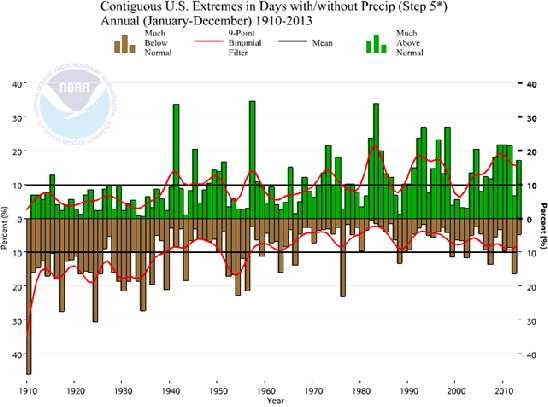
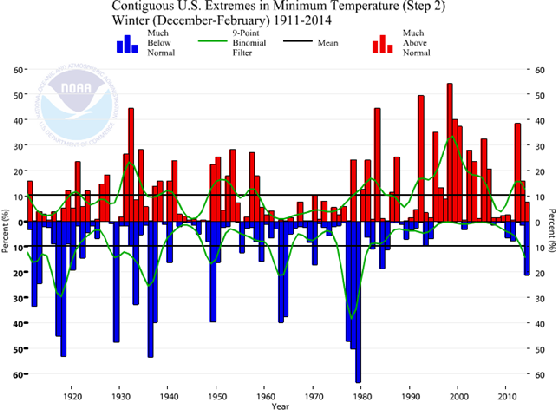
US Climate Extreme Index
CLAIM
In the United States, an index of climate extremes — hot and cold, wet and dry —
kept by the National Oceanic and Atmospheric Administration has jumped 30 percent
from 1992 to 2013, not counting hurricanes, based on 10-
FACT
The index he refers to, of course, is the one that counts a mild winter as extreme. It is the same index which regards 1936 as one of the least extreme years, although it had the 2nd coldest winter on record, and the hottest summer. NOAA’s system is so sophisticated that it averages the two together to make the year average!
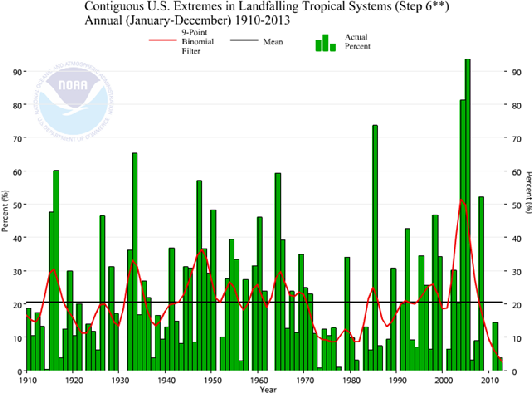
Nevertheless, wildfire acreage has been declining during the last decade.
Greenland & Antarctica
CLAIM
And some of the biggest climate change effects on land are near the poles, where people don’t often see them. From 1992 to 2011, Greenland’s ice sheet lost 3.35 trillion tons of ice, according to calculations made by scientists using measurements from NASA’s GRACE satellite. Antarctica lost 1.56 trillion tons of ice over the same period.
FACT
GRACE satellite data only began to be collected in 2002, so we simply don’t know what has happened since 1992. Moreover, margins of error, and issues such as glacial isostatic adjustment make any trends over such a short period of time meaningless.
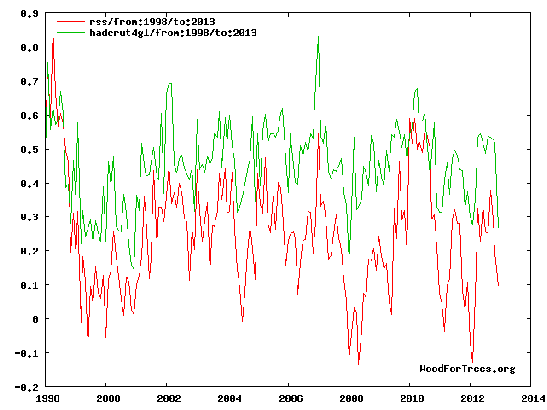
CO2 Emissions
CLAIM
Scientists simply point to greenhouse gas emissions, mostly carbon dioxide, that
form a heat-
FACT
Between 1998 and 2013, annual global emissions of CO2 increased by 48%, according to CDIAC.
During the same period, global temperatures have been flat.
Read the Original at: https://notalotofpeopleknowthat.wordpress.com/2014/12/05/educating-
| Warming Stopped |
| NOAA Data |
| NorthWest |
| Oregon |
| Washington |
| Extreme Weather |
| Past Was Warmer |
| NASA: 30's Hotter |
| HistoryOFAlarmism |
| Central England |
| Temperature History |
| MultiProxy |
| treemometers |
| Northwest Passage |
| Acidification-Ball |
| Acidification-Fulks |
| Acidification-Idso |
| Selected Emails |
| CRU Emails - html formatted |
| CRU Emails Simple Format |
| CRU Emails UnFormatted |
| DCPS paper |
| CRU_Files_Notice |
| False Deadlines |
| Hockey Stick Links |