Debunking the Climate Scam
Billions of Dollars -
Greedy Green Corporations -
No Warming For Two decades -
Bought and Paid For Organizations

5000 Years Of Climate Change From Greenland Ice Cores

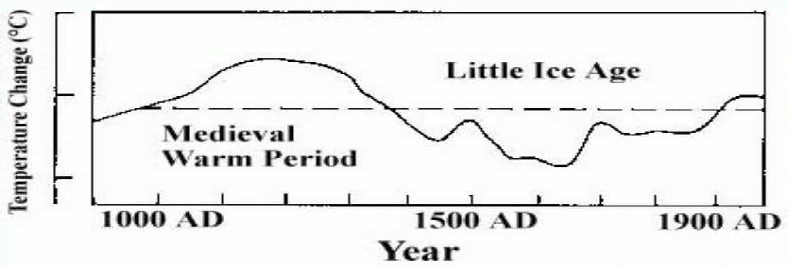
This 1990 IPCC graph shows that current temperatures are much lower than in the recent past and thus was not alarming.
Later, the IPCC picked up Mann’s :hockey stick” (below) and suddenly the world had
a climate problem. The only problem was that the “hockey stick” had a number of serious
flaws and was quietly de-
World Temperature History published by the IPCC in 1990
Michael Mann’s Hockey Stick published in 1998 (And Al Gore’s too!)
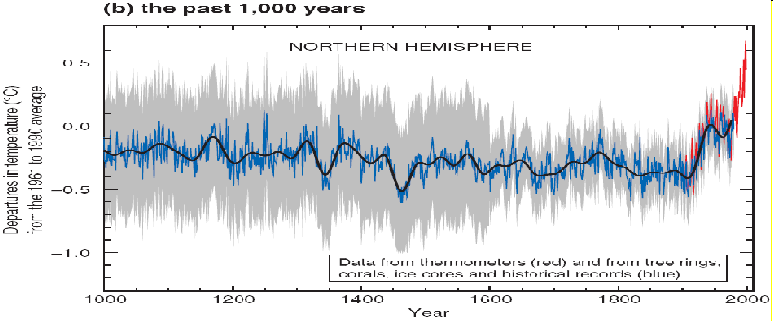
Obvious problems:
- The rise in temperature started just after 1900, perhaps 1910, but man’s CO2 emissions were very small before 1950.
- The “tree rings, corals and historical records” end at about 1980, while the report was published in 2001. Where is the later data? Some critics observed that tree rings started diverging from temperature during that time period.
- The well proven, “little ice age” is missing.
- The well proven “medieval warm period” is missing. (earlier IPCC reports(above) show these features prominently, the “medieval warming” period’s temperature being greater than today's.)
Graph from IPCC report:, pg 3(13)
The above graph first appeared in Nature 392: 779-
Many press reports said that the North report supported the “hockey stick”, however looking beyond the summary reveals a different perspective:
(The below is cut and pasted from the report with our comments in [brackets])
Surface Temperature Reconstructions for the Last 2,000 Years
Committee on Surface Temperature Reconstructions for the Last 2,000 Years,
National Research Council
From Page 111 (sheet 126) bold added:
OVERALL FINDINGS AND CONCLUSIONS
Based on its deliberations and the materials presented in Chapters 1_11 and elsewhere,
the committee draws the following overall conclusions regarding large_scale surface temperature
reconstructions for the last 2,000 years:
* The instrumentally measured warming of about 0.6?C during the 20th century is also reflected in borehole temperature measurements, the retreat of glaciers, and other observational evidence, and can be simulated with climate models.
.......[This verifies that there was about a 0.6?C temperature increase during the 20th century (see below)]
* Large_scale surface temperature reconstructions yield a generally consistent picture of temperature trends during the preceding millennium, including relatively warm conditions centered around A.D. 1000 (identified by some as the “Medieval Warm Period”) and a relatively cold period (or “Little Ice Age”) centered around 1700. The existence and extent of a Little Ice Age from roughly 1500 to 1850 is supported by a wide variety of evidence including ice cores, tree rings, borehole temperatures, glacier length records, and historical documents.
......[This re_affirms the existence of a “little ice age”]
Evidence for regional warmth during medieval times can be found in a diverse but more limited set of records including ice cores, tree rings, marine sediments, and historical sources from Europe and Asia, but the exact timing and duration of warm periods may have varied from region to region, and the magnitude and geographic extent of the warmth are uncertain.
....[This re_affirms the existence of a “medieval warm period”]
....[Remember the famous “hockey stick” chart? It DOES NOT show either the “little ice age” or “medieval warm period”. This omission disproves the “hockey stick” chart and the data/methods used to create it. Much of the climate field uses similar data and methods.]
* It can be said with a high level of confidence that global mean surface temperature was higher during the last few decades of the 20th century than during any comparable period during the preceding four centuries. This statement is justified by the consistency of the evidence from a wide variety of geographically diverse proxies.
....[This is the headline for many newspapers. Most forgot to mention that the “preceding four centuries” started in the middle of the “little ice age (above). In other words, we are warming up after the little ice age.]
* Less confidence can be placed in large_scale surface temperature reconstructions for the period from A.D. 900 to 1600. Presently available proxy evidence indicates that temperatures at many, but not all, individual locations were higher during the past 25 years than during any period of comparable length since A.D. 900. The uncertainties associated with reconstructing hemispheric mean or global mean temperatures from these data increase substantially backward in time through this period and are not yet fully quantified.
* Very little confidence can be assigned to statements concerning the hemispheric mean or global mean surface temperature prior to about A.D. 900 because of sparse data coverage and because the uncertainties associated with proxy data and the methods used to analyze and combine them are larger than during more recent time periods.
.....[ This says that we really don’t know enough about climate before A.D 900. This suggests that we are incapable of judging today’s climate in a proper historical context, considering that there has been 12,000 years of ups and downs since the last ice age. We only know about 10% of this time span to a sufficient degree.]
__________________________ From page 21 (sheet36) Bold Added ____________________________________
Based on the analyses presented in the original papers by Mann et al. and this newer supporting evidence, the committee finds it plausible that the Northern Hemisphere was warmer during the last few decades of the 20th century than during any comparable period over the preceding millennium.
.....[Note that this claim is only “plausible”, not likely or probable or “supported by a wide variety of evidence” (see above)]
The substantial uncertainties currently present in the quantitative assessment of large_scale surface temperature changes prior to about A.D. 1600 lower our confidence in this conclusion compared to the high level of confidence we place in the Little Ice Age cooling and 20th century warming. Even less confidence can be placed in the original conclusions by Mann et al. (1999) that “the 1990s are likely the warmest decade, and 1998 the warmest year, in at least a millennium” because the uncertainties inherent in temperature reconstructions for individual years and decades are larger than those for longer time periods, and because not all of the available proxies record temperature information on such short timescales.
....[Here is the often heard statement that we are the warmest in 1000 years. It is given “less confidence” than “plausible” (see above). Effectively, it is shown to be baseless.]
______________________Some Thoughts About the Above Report ______________________________
We believe that the two most gripping claims about global warming have been shown to be wrong. The other major claim, that we are the warmest in 400 years is essentially a statement that we are warming after the “little ice age.” Is that bad?
National Academy of Sciences, National Research Council report (North Report)
National Academy of Sciences, National Research Council report (Wegman Report)
Wegman’s bio from George Mason U: http://www.galaxy.gmu.edu/stats/faculty/wegman.html Here is a short sample:
Dr. Wegman served in national office in the Institute of Mathematical Statistics, the American Statistical Association and the American Association for the Advancement of Science. He served as President of the International Association for Statistical Computing. He has published more than 160 papers and eight books. His professional stature has been recognized by his election as Fellow of the American Statistical Association, the American Association for the Advancement of Science, the Washington Academy of Science and the Institute of Mathematical Statistics.
Wegman Report, item 7, page 49 (MBH is the hockey stick paper): Our committee believes that the assessments that the decade of the 1990s was the hottest decade in a millennium and that 1998 was the hottest year in a millennium cannot be supported by the MBH98/99 analysis.
Wegman Report, item 7, page 49: The cycle of Medieval Warm Period and Little Ice
Age that was widely recognized in 1990 has disappeared from the MBH98/99 analyses,
thus making possible the hottest decade/hottest year claim. However, the methodology
of MBH98/99 suppresses this low frequency information. The paucity of data in the
more remote past makes the hottest-
Wegman Report, item 6, page 49: Generally speaking, the paleoclimatology community has not recognized the validity of the MM05 papers and has tended dismiss their results as being developed by biased amateurs.
Wegman Report, page 52: Conclusion 4. While the paleoclimate reconstruction has
gathered much publicity because it reinforces a policy agenda, it does not provide
insight and understanding of the physical mechanisms of climate change except to
the extent that tree ring, ice cores and such give physical evidence such as the
prevalence of green-
Wegman Report, page 49: 1. In general we found the writing of MBH98 somewhat obscure and incomplete. The fact that MBH98 issued a further clarification in the form of a corrigendum published in Nature (Mann et al. 2004) suggests that these authors made errors and incomplete disclosures in the original version of the paper. This also suggests that the refereeing process was not as thorough as it could have been. . .
Wegman Report, page 49: 2. In general, we find the criticisms by MM03, MM05a and MM05b to be valid and their arguments to be compelling. We were able to reproduce their results and
offer both theoretical explanations (Appendix A) and simulations to verify that their observations were correct. . .
Wegman Report, page 49, item 3: . . Because the temperature profile in the 1902-
Wegman Report, page 49: Although we have not addressed the Bristlecone Pines issue extensively in this report except as one element of the proxy data, there is one point worth mentioning. Graybill and Idso (1993) specifically sought to show that Bristlecone Pines were CO2 fertilized. Bondi et al. (1999) suggest [Bristlecones] “are not a reliable temperature proxy for the last 150 years. . .
Wegman Report, page 52: Conclusion 4. While the paleoclimate reconstruction has gathered
much publicity because it reinforces a policy agenda, it does not provide insight
and understanding of the physical mechanisms of climate change except to the extent
that tree ring, ice cores and such give physical evidence such as the prevalence
of green-
Wegman: page 4: In our further exploration of the social network of authorships in temperature reconstruction, we found that at least 43 authors have direct ties to Dr. Mann by virtue of coauthored papers with him. Our findings from this analysis suggest that authors in the area of paleoclimate studies are closely connected and thus “independent studies” may not be as independent as they might appear on the surface.
(Bold added; from: 07142006_Wegman_Report.pdf )
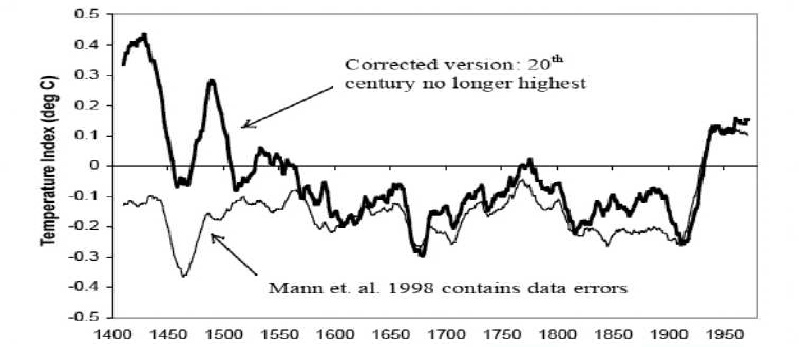
Corrected Hockey Stick
As mentioned above, McIntyre & McKitrick(2003) found errors in the hockey stick. They also published a corrected version shown above.
| Warming Stopped |
| NOAA Data |
| NorthWest |
| Oregon |
| Washington |
| Extreme Weather |
| Past Was Warmer |
| NASA: 30's Hotter |
| PastBeliefs |
| HistoryOFAlarmism |
| Central England |
| Temperature History |
| MultiProxy |
| treemometers |
| Northwest Passage |
| Acidification-Ball |
| Acidification-Fulks |
| Acidification-Idso |
| Selected Emails |
| CRU Emails - html formatted |
| CRU Emails Simple Format |
| CRU Emails UnFormatted |
| DCPS paper |
| CRU_Files_Notice |
| False Deadlines |
| Hockey Stick Links |