Debunking the Climate Scam
Billions of Dollars -
Greedy Green Corporations -
No Warming For Two decades -
Bought and Paid For Organizations

5000 Years Of Climate Change From Greenland Ice Cores

Increasing Atmospheric CO2: Manmade…or Natural?
I’ve usually accepted the premise that increasing atmospheric carbon dioxide concentrations are due to the burning of fossil fuels by humans. After all, human emissions average around twice that which is needed to explain the observed rate of increase in the atmosphere. In other words, mankind emits more than enough CO2 to explain the observed increase in the atmosphere.
Furthermore, the ratio of the C13 isotope of carbon to the normal C12 form in atmospheric CO2 has been observed to be decreasing at the same time CO2 has been increasing. Since CO2 produced by fossil fuel burning is depleted in C13 (so the argument goes) this also suggests a manmade source.
But when we start examining the details, an anthropogenic explanation for increasing atmospheric CO2 becomes less obvious.
For example, a decrease in the relative amount of C13 in the atmosphere is also consistent with other biological sources. And since most of the cycling of CO2 between the ocean, land, and atmosphere is due to biological processes, this alone does not make a decreasing C13/C12 ratio a unique marker of an anthropogenic source.
This is shown in the following figure, which I put together based upon my analysis
of C13 data from a variety of monitoring stations from the Arctic to the Antarctic.
I isolated the seasonal cycle, interannual (year-
The seasonal cycle clearly shows a terrestrial biomass (vegetation) source, as we expect from the seasonal cycle in Northern Hemispheric vegetation growth. The interannual variability looks more like it is driven by the oceans. The trends, however, are weaker than we would expect from either of these sources or from fossil fuels (which have a C13 signature similar to vegetation).
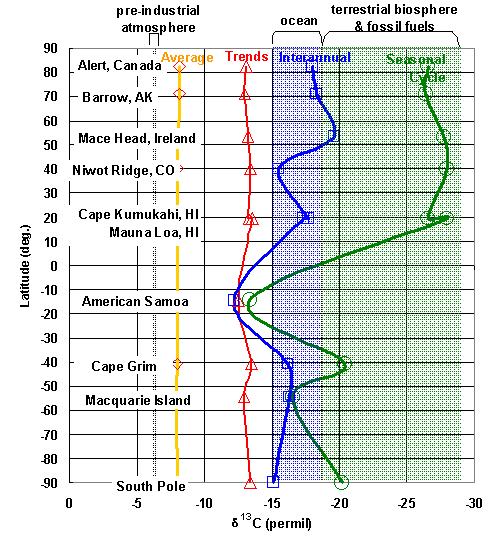
C13/C12 isotope ratios measured at various latitudes show that CO2 trends are not necessarily from fossil fuel burning.
Secondly, the year-
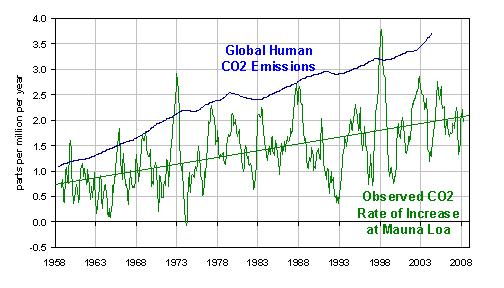
The yearly increase of CO2 measured at Mauna Loa shows huge natural fluctuations which are caused by temperature changes.
In fact, it turns out that these large year-
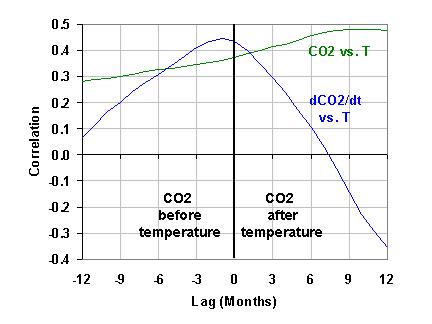
Year to year CO2 fluctuations at Mauna Loa show that the temperature changes tend to precede the CO2 changes.
If temperature is indeed forcing CO2 changes, either directly or indirectly, then there should be a maximum correlation at zero months lag for the change of CO2 with time versus temperature (dCO2/dt = a + b*T would be the basic rate equation). And as can be seen in the above graph, the peak correlation between these two variables does indeed occur close to zero months.
And this raises an intriguing question:
If natural temperature changes can drive natural CO2 changes (directly or indirectly)
on a year-
After all, we already know that the rate of human emissions is very small in magnitude
compared to the average rate of CO2 exchange between the atmosphere and the surface
(land + ocean): somewhere in the 5% to 10% range. But it has always been assumed
that these huge natural yearly exchanges between the surface and atmosphere have
been in a long term balance. In that view, the natural balance has only been disrupted
in the last 100 years or so as humans started consuming fossil fuel, thus causing
the observed long-
But since the natural fluxes in and out of the atmosphere are so huge, this means that a small natural imbalance between them can rival in magnitude the human CO2 input. And this clearly happens, as is obvious from the second plot shown above!
So, the question is, does long-
Let’s look more closely at just how large these natural, year-
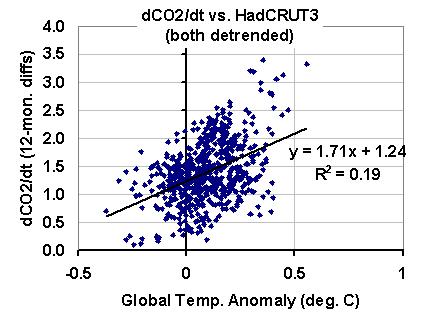
Although there is considerable scatter in the above figure, we see an average relationship
of 1.71 ppm/yr for every 1 deg C. change in temperature. So, how does this compare
to the same relationship for the long-
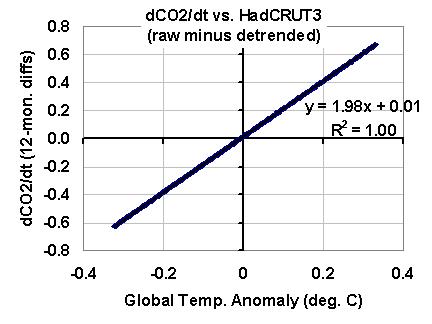
This means that most (1.71/1.98 = 86%) of the upward trend in carbon dioxide since CO2 monitoring began at Mauna Loa 50 years ago could indeed be explained as a result of the warming, rather than the other way around.
So, there is at least empirical evidence that increasing temperatures are causing some portion of the recent rise in atmospheric CO2, in which case CO2 is not the only cause of the warming.
Now, the experts will claim that this is all bogus, because they have computer models of the carbon budget that can explain all of long term rise in CO2 as a result of fossil fuel burning alone.
But, is that the ONLY possible model explanation? Or just the one they wanted their models to support? Did they investigate other model configurations that allowed nature to play a role in long term CO2 increase? Or did those model simulations show that nature couldn’t have played a role?
This is the trouble with model simulations. The ones that get published are usually the ones that support the modeler’s preconceived notions, while alternative model solutions are ignored.
If an expert in this subject sees a major mistake I’ve made in the above analysis,
e-
January 21st, 2009 by Roy W. Spencer, Ph. D.
| Warming Stopped |
| NOAA Data |
| NorthWest |
| Oregon |
| Washington |
| Extreme Weather |
| Past Was Warmer |
| NASA: 30's Hotter |
| PastBeliefs |
| HistoryOFAlarmism |
| Central England |
| Temperature History |
| MultiProxy |
| treemometers |
| Northwest Passage |
| Acidification-Ball |
| Acidification-Fulks |
| Acidification-Idso |
| Selected Emails |
| CRU Emails - html formatted |
| CRU Emails Simple Format |
| CRU Emails UnFormatted |
| DCPS paper |
| CRU_Files_Notice |
| False Deadlines |
| Hockey Stick Links |