Debunking the Climate Scam
Billions of Dollars -
Greedy Green Corporations -
No Warming For Two decades -
Bought and Paid For Organizations

History of Earth's Temperature
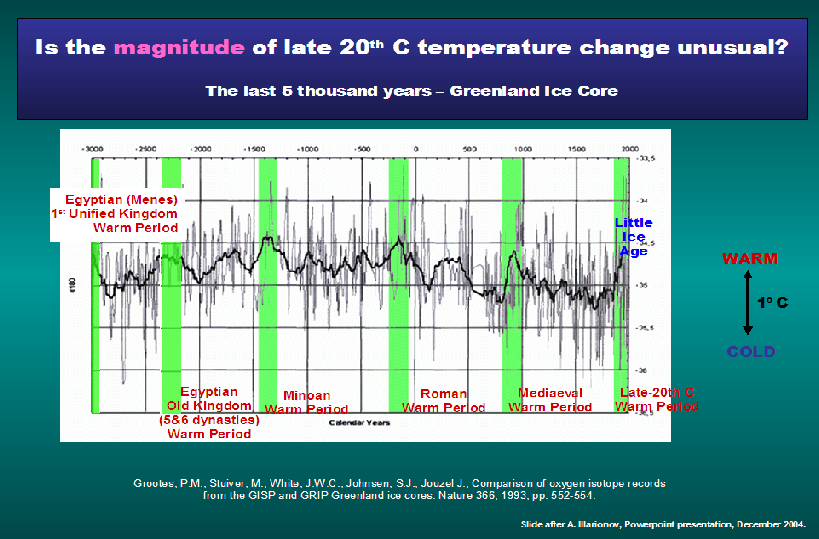
- Six warm periods are visible in this 5,000 year temperature history. Most of the warm periods were warmer than today.
- One can see that the earliest warm periods each got warmer until the middle of the chart, then later warm periods were not as warm.
- One can also see the rates of increase and that rapid changes in climate are quite common.
Nothing Unusual!
Charts & Graphs on this page From Bob Carter’s video ALSO
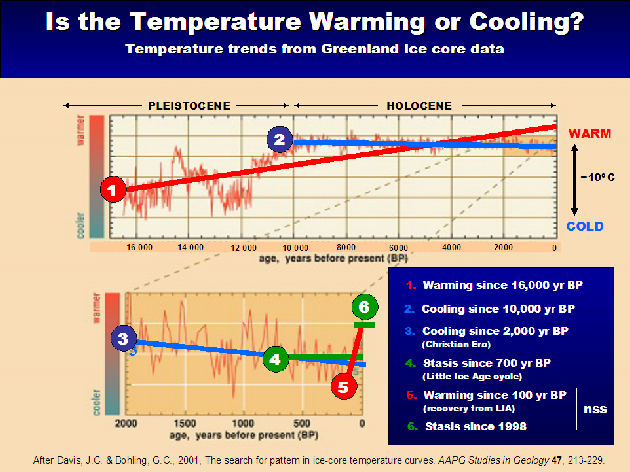
Warming or Cooling depends on the time scale.
Upper graph:
We have been warming for the last 16,000 years. (1)
We have been cooling for the last 10,000. (2)
Lower Graph:
Cooling for the last 2000 years. (3)
Stable for the last 700 years. (4)
Warming for the last 100 years since the little ice age. (5)
Stable for the last 10 years. (6)
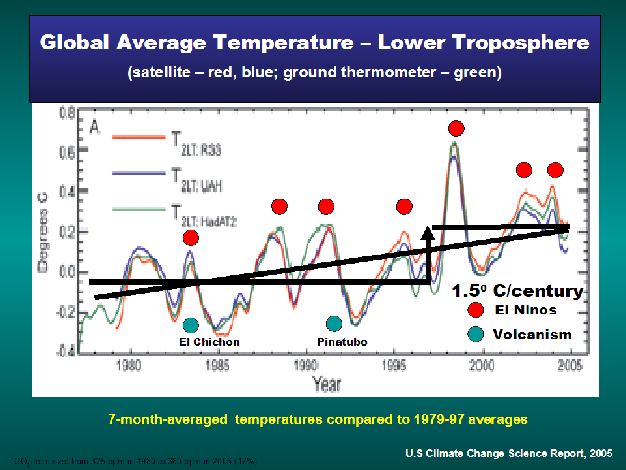
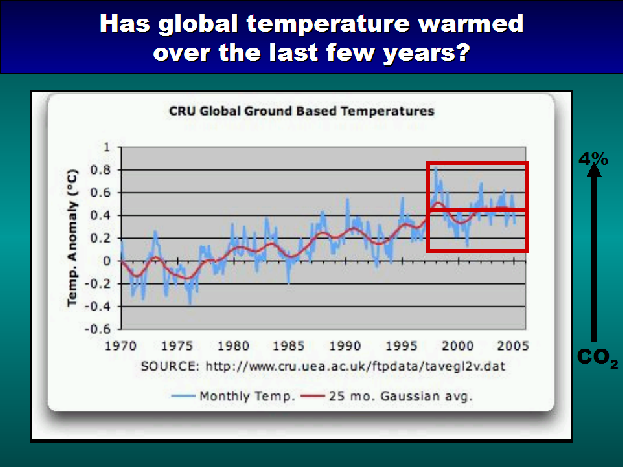
A better representation of the last 30 years is , not steady warming, but a single event, just after 1995, which stepped up the temperature.
The last ten years have been stable
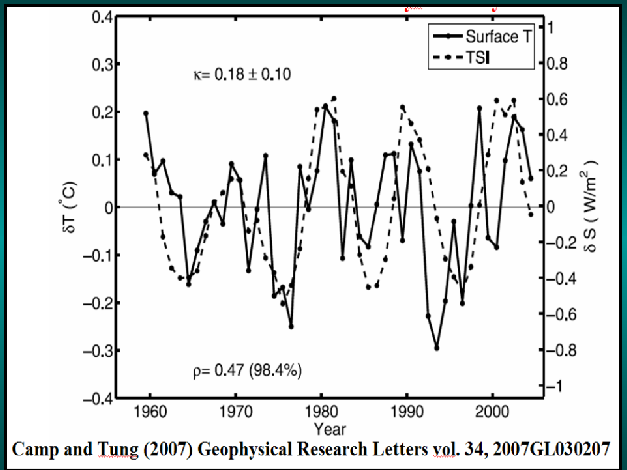
Solar radiation is a much better match to temperature changes than CO2.
Dotted line is “Total Solar Index”
Solid line is temperature.
Chart is from Geophysical Research Letters
Caption: Grootes, P.M., Stuiver, M., White, J.W.C., Johnsen, S.J., Jouzel J., Comparison
of oxygen isotope records from the GISP and GRIP Greenland ice cores. Nature 366,1993,
pp. 552-
Slide after A. Illarionw, PowerPoint presentation, December 2004.