Debunking the Climate Scam
Billions of Dollars -
Greedy Green Corporations -
No Warming For Two decades -
Bought and Paid For Organizations

How Good Is Our Climate Data?
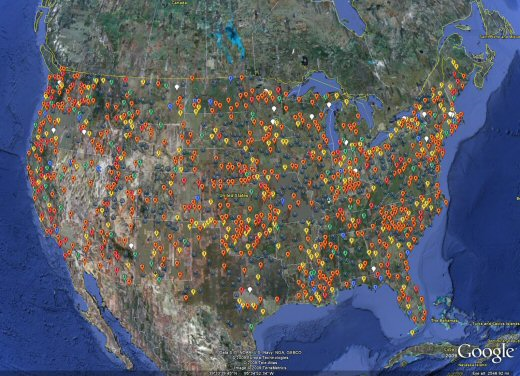
Surfacestations project reaches 70% of the network surveyed. 854 of 1221 stations have been examined in the USHCN network. The Google Earth map below shows current coverage.
Notice the generally low quality of the stations. From: http://surfacestations.org/
Only 11% of stations surveyed met the required Class I or Class II requirement of likely measurement error under 1C.
Quantifying the influence of anthropogenic surface processes and inhomogeneities on gridded global climate data, JOURNAL OF GEOPHYSICAL RESEARCH, VOL. 112, D24S09, doi:10.1029/2007JD008465, 2007
Local land surface modification and variations in data quality affect temperature
trends in surface-
Peer Reviewed Paper concludes half of reported warming is due to data contamination
Small California counties show less warming than large counties
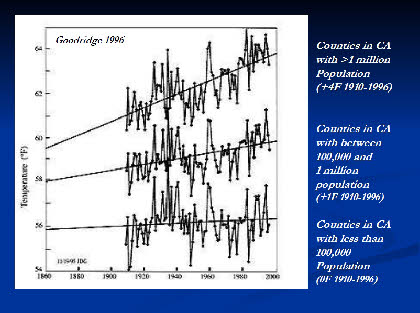
From LaDochy:
- Most regions showed a stronger increase in minimum temperatures than with mean and maximum temperatures.
- Areas of intensive urbanization showed the largest positive trends, while rural,
non-
agricultural regions showed the least warming. - Strong correlations between temperatures and Pacific sea surface temperatures (SSTs) particularly Pacific Decadal Oscillation (PDO) values, also account for temperature variability throughout the state.
- Southern California had the highest rates of warming, while the NE Interior Basins division experienced cooling.
- Large urban sites showed rates over twice those for the state, for the mean maximum temperatures, and over 5 times the state's mean rate for the minimum temperatures.
See: Recent California climate variability: spatial and temporal patterns in temperature
trends, LaDochy, Steve | Medina, Richard | Patzert, William. Climate Research [Clim.
Res.]. Vol. 33, no. 2, pp. 159-
Graph from Goodridge 1996
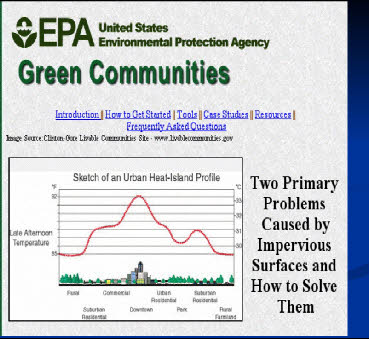
EPA chart of Heat Island Effect shows over 3 degrees of warming
Much of China’s warming due to heat island effect
“Urban-
Fraud?
Phil Jones and the Great Leap Forward
by Steve McIntyre on February 26th, 2007
The other key network in the seminal Jones et al 1990 on urbanization (relied upon
in AR4) is their Chinese network. The idea that China between 1954 and 1983 -
THE FRAUD ALLEGATION AGAINST SOME CLIMATIC
RESEARCH OF WEI-
The Limehouse Cut, London E14 6N, UK; doug.keenan@informath.org
Wei-
decades. I have formally alleged that he committed fraud in some of his research,
including research cited by the Fourth Assessment Report of the IPCC (2007) on
“urban heat islands” (a critical issue). Herein, the allegation is reviewed, and some
of its implications are explicated.
. . .
3. CONCLUSIONS
Two conclusions are manifest. First, there is a serious lack of integrity in some of
Wang’s research. Second, the insignificance of urbanization effects on temperature
measurements has not been established as reliably as the IPCC (2007) assumes.
Something else, more general, might also be argued: the failure of the scientific
community to require data to be made available constitutes a serious departure from
the transparency that is widely accepted to be a prerequisite for integrity in human
affairs.11
. . .
Fabrications
Regarding station movements over time, the papers of Jones et al. and Wang et al.
make the following statements.
The stations were selected on the basis of station history: we
chose those with few, if any, changes in instrumentation, location
or observation times. [Jones et al.]
They were chosen based on station histories: selected stations
have relatively few, if any, changes in instrumentation, location,
or observation times…. [Wang et al.]
. . .
The essential point here is that the quoted statements from Jones et al. and Wang et al. cannot be true and could not be in error by accident. The statements are fabricated.
Chuine et al. had the data; so they must have known that their conclusions were unfounded. In other words, there is prima facie evidence of scientific fraud.
To study the paper properly, I needed to have the authors' data. So I e-
Looking at the data made it manifest that there are serious problems with the work of Chuine et al. In particular, the authors' estimate for the summer temperature of 2003 was higher than the actual temperature by 2.4 °C (about 4.3 °F). This is the primary reason that 2003 seemed, according to the authors, to be so tremendously warm.
There is also another reason. The three warmest years on record, prior to 2003, were 1945, 1947, and 1952. (The instrumental record goes back to 1922, or even 1883 if we accept some inaccuracies.) The estimate of Chuine et al. for the summer temperature in each of those years was much lower than the actual temperature.
Resultant paper:
Theor. Appl. Climatol. 87, 255–256 (2007)
Summary
It has recently been claimed that the April–August
temperature in France, in any given year, can be estimated
from the harvest date of grapes grown there. Based on this
claim, it was asserted that 2003 was the warmest year in the
last six centuries. Herein, it is shown that the grape-
temperature estimates are highly unreliable, and thus that
the assertion is unfounded.
: either the peer reviewers did not have an appropriate background in mathematical data analysis—upon which the paper heavily relied—or they did not honestly check the paper.
What is important here is not the truth or falsity of the assertion of Chuine et al. about Burgundy temperatures. Rather, what is important is that a paper on what is arguably the world's most important scientific topic (global warming) was published in the world's most prestigious scientific journal with essentially no checking of the work prior to publication.
Moreover—and crucially—this lack of checking is not the result of some fluke failures in the publication process. Rather, it is common for researchers to submit papers without supporting data, and it is frequent that peer reviewers do not have the requisite mathematical or statistical skills needed to check the work (medical sciences largely excepted). In other words, the publication of the work of Chuine et al. was due to systemic problems in the scientific publication process.
The systemic nature of the problems indicates that there might be many other scientific papers that, like the paper of Chuine et al., were inappropriately published. Indeed, that is true and I could list numerous examples. The only thing really unusual about the paper of Chuine et al. is that the main problem with it is understandable for people without specialist scientific training.
Another Failure of Peer Review
One of the biggest cases of academic fraud in medical history
From: Junkfood Science
One of the largest known cases of academic fraud and misconduct made the news this week when Anesthesiology News reported that a leading medical researcher was found to have fabricated much, if not all, of the data in his research.
Scott S. Reuben, M.D., of Baystate Medical Center in Springfield, Massachusetts,
is said to have made up and falsified data in at least 21, and perhaps many more,
studies published at least since 1996, according to the results of a year-
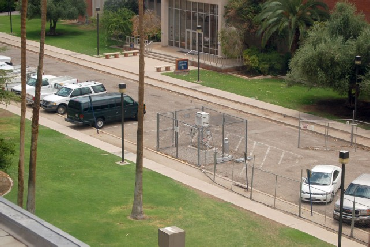
Here’s Why The Quality Is Low
Here is a USHCN station in a parking lot
(remember they are supposed to be in the middel of a grassy field)
From: surfacestations.org
Report on the stations:
“Is The U.S. Surface Temperature Record Reliable?” By Anthony Watts
Papers on Uncertainty
Recent Papers On The Uncertainty and Biases In the Long Term Assessment Of The Global Average Surface Temperature Trend
The multi-
Pielke Sr., R.A., C. Davey, D. Niyogi, S. Fall, J. Steinweg-
* The use of one average temperature trend, which neglects that long wave cooling is proportional to the 4th power of temperature. This is a warm bias if the predominance of temperature increases are at cold absolute temperatures and a cool bias if at warm absolute temperatures [Section 2].