Debunking the Climate Scam
Billions of Dollars -
Greedy Green Corporations -
No Warming For Two decades -
Bought and Paid For Organizations

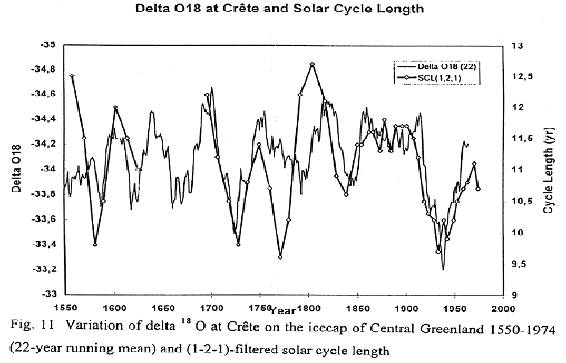
Solar Cycles Provide An Excellent Fit To Clouds
Solar Cycles Provide An Excellent Fit To Climate
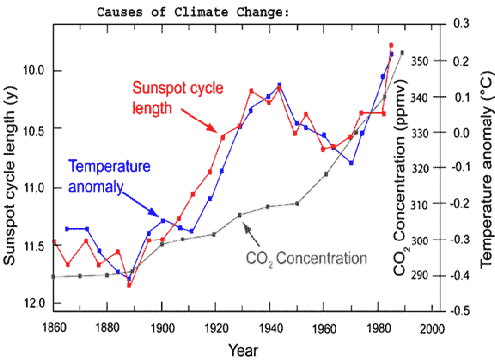
Notice the dip in both solar and temperature from about 1940-
Graph adapted by Dr. Tim Patterson.from: Friis-
The Sun is a much better short term fit to climate than CO2.
Graph from: Long-
The Sun is a much better long term fit to climate than CO2
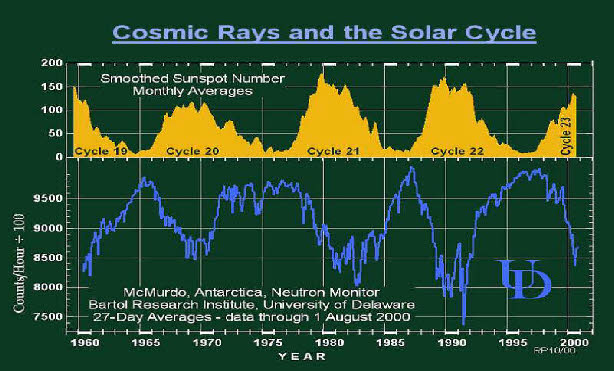
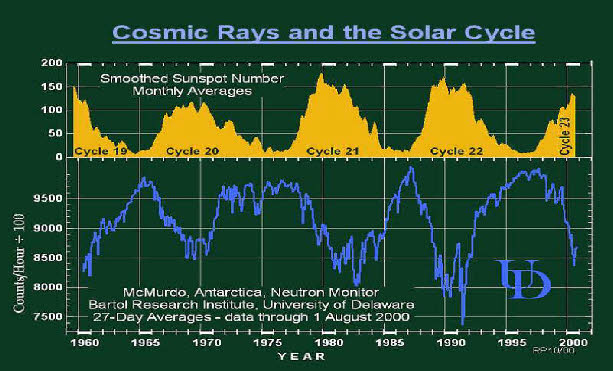
There is a close relationship between the number of sunspots and cosmic rays.
Notice that the peaks of the lower (blue) line match up with the valleys of the upper (orange) chart.
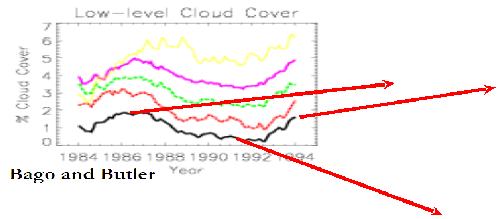
There is a close relationship between cosmic rays and cloud cover
Higher cosmic rays, more clouds. (Red arrow from cloud cover peak to cosmic ray peak)
Lower cosmic rays, fewer clouds. (red arrow from cloud cover dip to cosmic ray bottom.)
“anthropogenic sources alone contributed to a warming of 0.14 +/-
“Increased solar activity is responsible for a total increase of 0.47 +/-
Total: 0.61 +/-
Shaviv, N. J., 2005. On climate response to changes in the cosmic ray flux and radiative budget. J. Geophys. Rsch., VOL. 110, A08105, doi:10.1029/2004JA010866, 2005 https://agupubs.onlinelibrary.wiley.com/doi/epdf/10.1029/2004JA010866
¾ of warming due to solar activity: Nir J. Shaviv
CO2science has a lengthy list of quality articles about the solar connection at
http://www.co2science.org/subject/s/summaries/solarirradiance.php
The Resilient Earth: Climate Controlling Ocean Thermostat Discovered
A report in the December 3, 2010, issue of Science has reinforced what many scientists
have suspected all along: variation in the Sun's output causes significant change
in Earth's climate. Writing in “Dynamical Response of the Tropical Pacific Ocean
to Solar Forcing During the Early Holocene,” Thomas M. Marchitto, Raimund Muscheler,
Joseph D. Ortiz, Jose D. Carriquiry and Alexander van Geen present a high-
The influence of solar variability on Earth’s climate over centennial to millennial
time scales is the subject of considerable debate. The change in total solar irradiance
over recent 11-
A number of things stand out here. First, irradiance changes that have been dismissed by some in the CO2 fan club were shown to be sufficient to drive changes in the ENSO. Much like the atmospheric solar heat amplifier found previously, seemingly minor changes in solar output can cause big changes here on Earth. Because the Pacific region is so large, any thing that affects the ENSO also affects climate world wide.
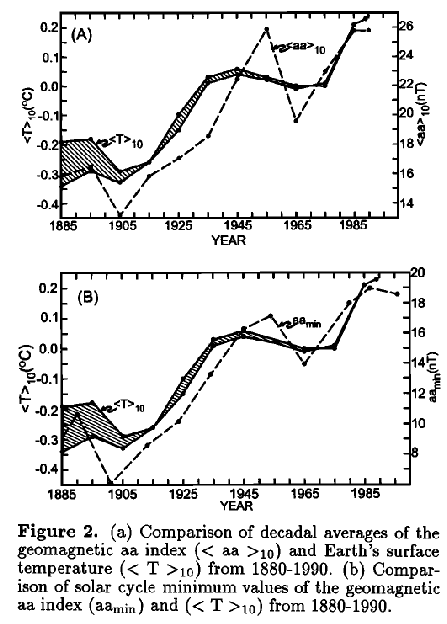
Solar variability and climate change: Geomagnetic aa index and global surface temperature
(Geophysical Research Letters Volume 25, Issue 7, pages 1035–1038, 1 April 1998)
During the past ~120 years, Earth's surface temperature is correlated with both decadal
averages and solar cycle minimum values of the geomagnetic aa index. The correlation
with aa minimum values suggests the existence of a long-
20 New Scientific Papers Link Modern Climate Trends To Solar Forcing
A Robust Sun-
“The emerging causal effects from SS [solar activity] to GT [global temperatures], especially for recent decades, are overwhelmingly proved” — Huang et al., 2017
Indirect Effects of the Sun on Earth’s Climate
From the linked article:
In this article, I explore the scientific literature on possible solar indirect effects on climate, and suggest a reasonable way of looking at them. This should also answer Leif Svalgaard’s question, though it seems rather unlikely that he would be unaware of any of the material cited here. Certainly just about everything in this article has already appeared on WUWT; the aim here is to present it in a single article (sorry it’s so long). I provide some links to the works of people like Jasper Kirkby, Nir Shaviv and Nigel Calder. For those who have time, those works are worth reading in their entirety.
Read the whole, excellent, article at Indirect Effects of the Sun on Earth’s Climate
|
Table of Contents: | |
|
1. Henrik Svensmark |
4. Ultra- |
|
2. Correlation |
5. The Non- |
|
3. Galactic Cosmic Rays |
6. A Final Quirk |