Debunking the Climate Scam
Billions of Dollars -
Greedy Green Corporations -
No Warming For Two decades -
Bought and Paid For Organizations

Water Vapor, NOT CO2 is the Most Effective Greenhouse Gas
In terms of mass, water vapour is much more prevalent (about 0.3% of atmospheric mass, compared to about 0.06% for CO2), and so is ~80% of all greenhouse gases by mass (~90% by volume). However, the radiative importance is less (since all molecules are not created equal).
. . . it's clear that water vapour is the single most important absorber (between 36% and 66% of the greenhouse effect), and together with clouds makes up between 66% and 85%. CO2 alone makes up between 9 and 26%,
. . . the maximum supportable number for the importance of water vapour alone is
about 60-
Water vapour is the most important greenhouse gas in the atmosphere.” (IPCC AR4, p 632). Local
The Heat Island Effect
(This section lifted from WattsUpWithThat.com)
Finally -
This is a small bombshell. I’ve been telling readers about UHI since this blog started. One notable example that I demonstrated by actual measurement is Reno, NV:
Click for larger image
The IPCC reports have minimized the effects of UHI on climate for quite some time.
From Warwick Hughes:
The IPCC drew that conclusion from the Jones et al 1990 Letter to Nature which examined temperature data from regions in Eastern Australia, Western USSR and Eastern China, to conclude that “In none of the three regions studied is there any indication of significant urban influence..” That has led to the IPCC claim that for decades, urban warming is less than 0.05 per century.
A paper in JGR that slipped by last fall without much notice (but know now thanks
to Warwick Hughes) is one from Phil Jones, the director of the Hadley Climate Center
in the UK. The pager is titled: Urbanization effects in large-
In it, Jones identifies an urban warming signal in China of 0.1 degrees C per decade. Or, if you prefer, 1 degree C per century. Not negligible by any means. Here is the abstract:
Global surface temperature trends, based on land and marine data, show warming
of about 0.8°C over the last 100 years. This rate of warming is sometimes questioned
because of the existence of well-
Even though Jones tries to minimize the UHI effect elsewhere, saying the UHI trends don’t contribute to warming in London and Vienna, what is notable about the paper is that Jones has been minimizing the UHI issues for years and now does an about face on China. And even more notable is that Jones result are directly at odds with another researcher at Hadley, Dr. David Parker.
It seems that Parker is looking more and more foolish with his attempts to make UHI “disappear” To back that up, the National Weather Service includes the UHI factor in one of it’s training course ( NOAA Professional Competency Unit 6 ) using Reno, NV.
In the PUC6 they were also kind enough to provide a photo essay of their own as well as a graph. You can click the aerial photo to get a Google Earth interactive view of the area. The ASOS USHCN station is right between the runways.
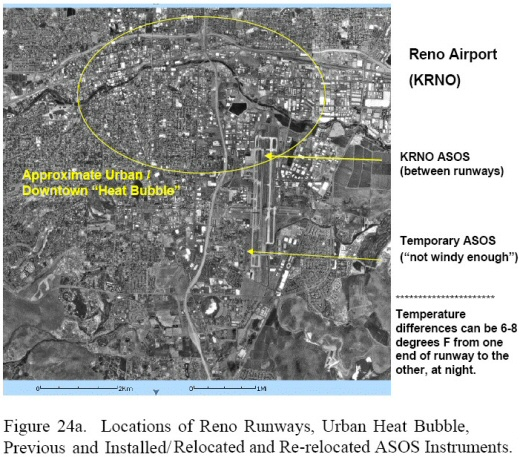
This is NOAA’s graph showing the changes to the official climate record when they made station moves:
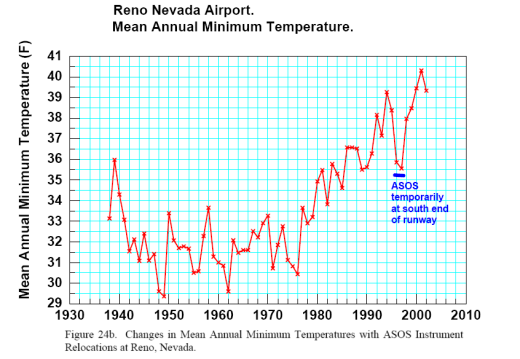
Source for 24a and 24b: NOAA Internal Training manual, 2004-
What is striking about this is that here we have NOAA documenting the effects of an “urban heat bubble” something that Parker 2003 et al say “doesn’t exist“, plus we have inclusion a site with known issues, held up as a bad example for training the operational folks, being used in a case study for the new USHCN2 system.
So if NOAA trains for UHI placement, and Hadley’s Dr. Jones admits it is real and quantifies it, I’m comfortable in saying that Parker’s claims of UHI being negligible are pure rubbish.
Its all about location, location, location. And climate monitoring stations that are poorly sited and that have been overrun by urban growth clearly don’t give a pure signal for assessment of long term climate trends. This puts a real kink in the validity of the surface temperature data in GISS and HadCRUT and could go a long way towards explaining the divergence between satellite and surface temperatures in recent years.
The above section lifted from WattsUpWithThat.com